Practice Essentials
Carotid ultrasonography (CUS) is a useful diagnostic tool for assessing cervical carotid artery disease. CUS can be highly reliable with proper technique; has no radiation risk; is well tolerated by all patients, including those who are claustrophobic in MRI machines; and has fewer risks than conventional angiography. The North American Symptomatic Carotid Endarterectomy Trial (NASCET), Asymptomatic Carotid Artery Stenosis Trial, and Asymptomatic Carotid Surgery Trial have helped establish guidelines for possible interventions based on CUS results. Further, intimal-medial thickness measurements are associated with an increased stroke risk. [1, 2, 3, 4, 5]
Trials include ACT-1, [6, 7] Asymptomatic Carotid Surgery Trial-2, Stent-Protected Angioplasty in asymptomatic Carotid artery stenosis versus Endarterectomy Trial-2, European Carotid Surgery Trial-2, and Carotid Revascularization Endarterectomy Versus Stenting Trial-2. These trials include diverse populations across Europe and North America to help provide clinicians with evidence that informs best clinical practice for asymptomatic carotid artery disease. [8]
CUS has some pitfalls when quantification of stenosis is attempted by spectral blood velocity parameters. In particular, for stenoses within the low (< 50%) to moderate (50-70%) range, intrastenotic velocity increases only slowly relative to the luminal loss, thereby resulting in a lack of diagnostic accuracy that often requires additional morphologic estimation of plaque stenosis in B-mode or color-Doppler ultrasonography images according to the NASCET method. [9]
In a study of handheld ultrasound versus conventional ultrasound for carotid plaque assessment of the carotid arteries of 200 patients referred for coronary angiography, the handheld device was found to be comparable to that of the conventional ultrasound system. The maximum plaque height (MPH) and total plaque area (TPA) of the carotid artery bulbs were measured. There was good correlation and no relevant bias between handheld and conventional ultrasound in measuring MPH (r = 0.84, P< 0.0001) and TPA (r = 0.94, P< 0.0001). In addition, there was good inter-rater reliability for online and offline measurements of MPH and offline measurements of TPA by handheld ultrasound (0.79, 0.76 and 0.85, respectively). [10]
Two-Step Procedure
Carotid ultrasonography is a 2-step, or duplex, procedure. The 2 steps are as follows:
Imaging:
-
Imaging is accomplished with the brightness-mode (B-mode) technique.
-
The image is usually viewed in grayscale, which is a brightness scale.
-
Sometimes, color flow information is superimposed on the grayscale image. By convention, the color of the pulsating artery is red. This is called color Doppler imaging.
Spectral analysis:
-
This allows measurement of blood flow velocity.
-
A probing cursor is placed in the artery (on the screen), and a signal representing blood flow velocity is generated.
-
The signal is both visual and auditory.
-
The signal has peaks and ebbs, which correspond to systolic and diastolic blood flow. The peaks and ebbs create the spectrum.
Physics: Basics
Knowledge of 3 physical properties is helpful in understanding basic carotid ultrasonography: pulse echo, hemodynamics, and the Doppler phenomenon.
Pulse-echo technique to image the vessel
An initial signal (pulse) is generated in the computer, sent through the transducer on the patient's neck, and then bounced off a variety of tissue boundaries.
The transducer detects a returning signal (echo).
The direction of the pulse and the time elapsed until the signal returns determine the position of the tissue boundary.
The echogenicity of an object on the image determines its brightness. Changes in plaque echogenicity, as measured by the quantitative computer-assisted ultrasonography index, could be a marker of plaque instability, as well as an indicator of plaque remodeling, thereby providing the means for monitoring anti-atherosclerosis drugs such as statins. [11]
An object that rebounds very little of the pulse, such as the fluid in a cyst, is hypoechoic. An object that rebounds much of the signal, such as heavily calcified plaque, is hyperechoic.
Hemodynamics of blood movement in an artery
The velocity changes on spectral analysis reflect changes in hemodynamics.
An important general rule for CUS is as follows: the greater the degree of stenosis, the higher the velocity.
Doppler phenomenon to assess velocity of blood as it moves past the probe
As with the pulse-echo technique, a pulse is emitted from the transducer at a certain frequency.
When the pulse hits the moving blood, it rebounds back to the probe; however, its frequency is changed.
The change in frequency (initial frequency minus returning frequency) is known as the Doppler shift. This shift correlates with changes in blood flow velocity.
An important concept in CUS is that the Doppler shift is dependent not only on the blood velocity and the initial frequency but also on the angle of the probe in relation to the moving blood. This is called angle dependency (see Physics: Advanced).
Physics: Advanced
Properties of waves
Like light, radiation, and audible sound, ultrasound is a wave. The properties of any wave are as follows: c = f λ (c = propagation speed of a wave [constant in a given medium], f = frequency, λ = wavelength).
A medium is a conduit through which the wave passes. Examples of media are air, water, and tissue. The value of c for a given wave differs from medium to medium but is always constant in a particular medium. In the context of this discussion, the medium is tissue and the value of c for ultrasound is 1540 m/s (or 1.54 mm/ms). Because c is constant, the wavelength increases as the frequency decreases; the converse is also true. Frequency is measured in cycles per second, called hertz (Hz). A cycle is one revolution of the wavelength. In CUS, the emitted frequency is millions of cycles per second. Therefore, it is measured in megahertz (MHz) (1 MHz = 1 million cycles/s). During spectral analysis, the Doppler shift is 1000-fold less than the emitted frequency. Therefore, it is measured in kilohertz (kHz) (1 kHz = 1000 cycles/s).
Sometimes, the term spatial pulse length (SPL) is used. It is equal to the number of cycles (n) in a pulse multiplied by the wavelength (SPL = n X λ). SPL is important in determining resolution.
Tissue attenuation
As ultrasound passes through tissue, some of the signal is lost through scattering, reflection, and absorption (conversion to heat). In tissue, attenuation (in decibels [dB]) = 0.5 × frequency × path length.
Therefore, the higher the frequency of the machine, the greater the attenuation, and the less can be imaged at a greater distance from the probe. On the other hand, higher frequencies mean shorter wavelengths and better resolutions. Therefore, a trade-off exists in adjusting frequencies.
Hemodynamics
Blood flow can be laminar, disturbed, turbulent, or plug. In CUS, the first 3 are important. When no stenosis is present, blood flow is laminar. Flow of blood is even, with the fastest flow in the middle and the slowest at the edges of the vessel. When a small degree of stenosis is present, the blood flow becomes disturbed and loses its laminar quality. Even in normal conditions, such flow can be seen around the carotid bulb. With even greater stenosis, the flow can become turbulent.
Reynolds number determines the level at which turbulent flow occurs. Its derivation is not necessary for routine CUS. The basic equation for flow is Q = Δ P/R (Q = flow, Δ P = pressure difference, R = resistance). This is known as the law of Poiseuille. Resistance is dependent on vessel length and radius and fluid viscosity, so that R = 8L v/π r4 (L = length, v = viscosity, r = radius). Thus, in normal hemodynamics, as vessel length increases or as fluid viscosity increases, so does resistance. As vessel radius increases, resistance decreases significantly (by a factor of 4).
Volume flow
In a stenotic vessel, volume flow remains constant. Volume flow is related to average speed and vessel area according to the following: Q = va × A (Q = volume flow, va = average speed, A = vessel area).
The continuity rule states that volume flow remains constant regardless of the degree of narrowing. Mathematically, this equation is Q1 = Q2 = Q3 (ie, volume flow 1 = volume flow 2 = volume flow 3). (See the image below.) Therefore, v1 A1 = v2 A2 = v3 A3, and v1 π r21 = v2 π r22 = v3 π r23.
 Continuity rule: Flow in Q1 = Q2 = Q3. Because the area is smaller in Q2, the velocity must increase to maintain flow.
va is proportional to the Doppler shift. Therefore, as vessel diameter (and area) decreases, blood velocity increases to maintain volume flow. The velocity increases by a factor of 2 for every unit decrease in diameter. (The only time volume flow may not be maintained is with severe stenosis [>90%] when the resistance effect dominates.)
Doppler effect
The Doppler effect is the change in frequency or wavelength due to motion of the wave source, receiver, or reflector of a wave source, as shown below.
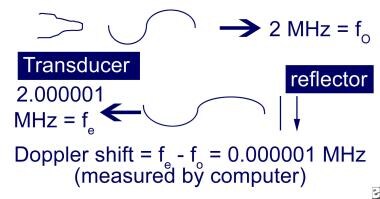 Doppler shift: A moving reflector produces a shift in the frequency of the incoming wave.
Since the probe is assumed to be still, the source of the change in frequency is the moving blood, which acts as both a receiver and reflector. Because it has both properties, it is known as a scatterer.
The equation for the emitted frequency from a scatterer is fe = fo (c+v)/(c-v) (fe = emitted frequency, fo = source frequency, c = propagation speed, v = scatterer speed). Propagation speed of ultrasound in tissue is 1540 m/s. The Doppler shift is equal to the source frequency minus the emitted frequency: fD = fo - fe = fo (2v)/(c-v) (fD = Doppler shift).
Doppler shift
Doppler shift is angle dependent in CUS. Ordinarily, the computer would use the equation in the previous paragraph to calculate velocity based on Doppler shift. However, 2 adjustments to the equation are made. First, the scatter speed in the denominator is dropped because its speed is negligible compared to that of ultrasound. Second, because the probe cannot be parallel to the arteries in the neck, angle adjustment is required. The correction is based on the cosine of the angle. This is what is meant by angle dependency. Thus, the previous equation becomes fD = 2fv(cos θ)/c.
If the equation has c replaced and is rearranged, it becomes v = 77 fD/f(cos θ) (v in cm/s, fD in kHz, f in MHz).
Because the estimation of actual angle increasingly errs with increasing angles (resulting in erroneous velocities) and the number of ultrasound waves that are reflected at the vessel wall increases with lower angles, an angle of 60o is commonly used. Therefore, the factors that affect Doppler shift are blood flow velocity, emitted frequency, and angle of insonation.
Artifacts
At least 18 artifacts have been identified in carotid ultrasound; most of them occur during imaging. The common artifacts include the following:
-
Reverberations: If 2 or more reflectors are in the sound path, multiple reflections (ie, reverberations) occur and may result in unreal images on the screen.
-
Refraction: A refracting object "bends" the ultrasonic waves so that a reflector is improperly positioned on the screen.
-
Shadowing: A strong reflector (eg, calcified plaque) reduces the quantity of ultrasound that is intended to pass beyond it; the object behind the reflector is "shadowed"; in the case of a plaque, the artifact proves to be helpful in identifying it.
-
Enhancing: Enhancing is the opposite of shadowing (eg, gallbladder).
-
Aliasing: This occurs during spectral analysis and color flow imaging. During spectral analysis, the spectrum is "wrapped" around the screen so that the top of the waveform is seen at the bottom. This problem can be corrected by increasing the pulse repetition frequency (PRF) (aliasing occurs when the highest Doppler shift is greater than half the PRF), increasing the Doppler angle, shifting the baseline, lowering the emitted frequency, or using a continuous wave device.
Instruments
The principal components of the ultrasound instrument are pictured in the following schematic drawing.
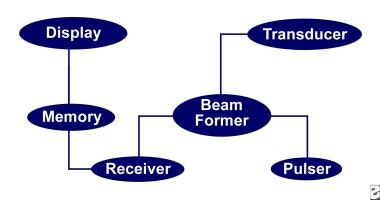
Pulser
The pulser generates short electrical pulses, which are converted to ultrasonic waves in the transducer. To image deeper structures, the PRF is set lower to allow the transducer more "listening" time. The shorter the pulse, the better the axial resolution. The narrower the pulse, the better the lateral resolution. Damping and using higher frequencies shorten the pulse. Axial resolution is equal to half of the SPL.
Beam former
The beam former controls the shape and direction of beam, known as focusing and steering. The beam former can be mechanical or electronic. Mechanical beam formers operate via an oscillatory mechanism. Electronic beam formers may be linear-switched arrays or linear-phased arrays. Focusing the beam narrows the pulse, which improves lateral resolution. Lateral resolution is equal to pulse width.
Transducer
The transducer contains the damping element, piezoelectric crystal (converts electric energy to ultrasonic waves), and the matching layer. The damping element is behind the crystal. It acts to reduce the pulse length and to improve lateral resolution. The matching layer is in front of the crystal. It reduces reflection of ultrasound at the transducer surface, improving ultrasonic transmission. Gel is applied to improve ultrasonic transmission. Even a very thin layer of air can reflect virtually all ultrasound.
Receiver
The receiver amplifies (ie, increases small signals), compensates (ie, equalizes signals that are at different distances from the transducer), compresses (ie, reduces the brightness scale to that which is visible to the eye), demodulates (ie, changes bidirectional signals and smoothens), and rejects (ie, gets rid of ambient noise).
Memory
Memory often is coded in binary.
Display
The display comprises a series of lines representing adjacent scan lines. The varieties of scanning formats are unlimited. The most commonly used methods are linear (ie, rectangular) and sector (ie, pie shaped). Deeper scanning theoretically requires that fewer scan lines be made available in order to maintain a real-time display. Alternatively, the number of scan lines can be preserved at the cost of a slower real-time display.
Technique
An ultrasound examination may be performed in many ways. Some of the ways are described below.
Enter the patient's name and examiner's name into the computer, take a focused history, measure bilateral brachial artery blood pressure, ask the patient to lie supine, and choose a conventional starting site (right or left - most use right).
Have the patient's head turned contralateral to the side being tested, place a towel on clothing for protection, apply gel liberally to the transducer or neck, and start the scan transversely from the proximal common carotid artery (CCA) moving distally.
Note the carotid bifurcation, look for plaques, attempt to characterize the nature of the plaque, and switch to the sagittal view; by convention, the patient's head is at the left on the screen, and images at the top of the screen are closest to the transducer; color may be used at this point to identify flow within the artery and potential areas of high velocity.
The on-screen probe is placed in the artery parallel to vessel walls; make sure to correct for excessive angles. The "gate" is the width of the listening window; the larger the gate, the more likely that signal will be detected. However, the trade-off is increased noise. Perform spectral analysis and find the highest velocity or frequency.
The procedure is done in the CCA, internal carotid artery (ICA), and external carotid artery (ECA); at least 2 or 3 spectral analyses of each vessel should be obtained. Color imaging and power Doppler may be used but may not necessarily provide additional information. After assessment of the anterior circulation, assess the vertebral circulation. Usually, the C4-C6 segment is accessible; to find the vertebral artery, angle the transducer laterally and inferiorly and identify the presence and direction of flow; velocity measurements may also be obtained.
Vessel identification
Identify the common carotid artery as follows:
-
Pulsatile walls
-
Smaller caliber than jugular vein
-
Systolic peak and diastolic endpoints in between that of external and internal carotid arteries on spectral analysis
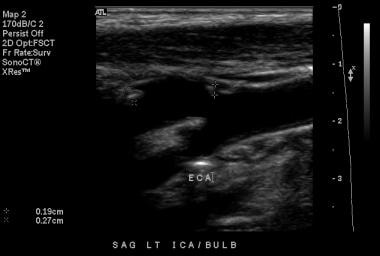
Distinguish internal and external carotid arteries as follows (also see the images below):
-
ECA has smaller caliber.
-
ICA is often posterolateral to ECA.
-
ECA may have superior thyroid artery branch coming off.
-
ECA has virtually no diastolic flow (ie, high resistance vessel) on spectral analysis.
 External carotid artery as seen on spectral analysis. Note the absence of flow in diastole and the sharp upstroke in systole.
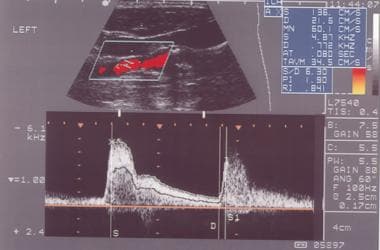 Internal carotid artery as seen on spectral analysis. Note that flow is continuous through diastole.
-
ECA shows positive "temporal tap" (ie, undulations in waveform with tapping of temporal artery).


Identify the vertebral arteries, as follows:
-
With probe parallel to the carotid, angle the probe laterally and inferiorly.
-
Look for vertebral body processes that appear as hypoechoic transverse bars.
-
The vertebral artery runs perpendicular to vertebral processes.
Color flow Doppler ultrasound can assist as follows:
-
Uses the method of autocorrelation rather than fast Fourier transform
-
Provides more rapid identification of vessel (especially vertebral artery)
-
Often helps identify area of highest velocity
-
Reduces scan time
-
May help in diagnosis of arterial occlusion
Power Doppler provide the following:
-
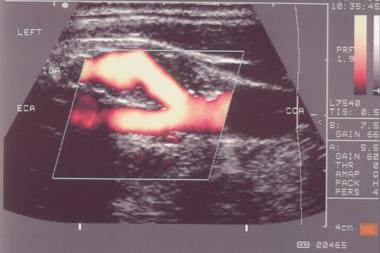
Color imaging that is independent of direction or velocity of flow.
-
Depicts angiographic-like picture of the artery.
Determining Degree of Stenosis
While some ultrasonographers attempt to characterize the degree of stenosis based on visual characteristics alone (similar to the North American Symptomatic Carotid Endarterectomy Trial method of angiographic estimation), estimation of stenosis solely based on this criterion is not reliable.
Commonly used methods of acoustic estimation of the degree of stenosis include the following:
-
Measurement of peak systolic velocities (PSV) and end diastolic velocities
-
Measurement of ratios (eg, ICA PSV/CCA PSV)
Some laboratories characterize degree of stenosis in terms of exact percentages. A range (eg, 50-69% stenosis) is probably more accurate. The ranges and measurements vary from laboratory to laboratory. Factors that affect measurements include the equipment used, the person performing the ultrasound, and the sites sampled for measurement (eg, the distal ICA often has higher velocities than the proximal ICA). When possible, laboratories should perform their own correlations with angiographic measurements for quality control.
Doppler ultrasonography and pulse Doppler ultrasonography have been used for detecting carotid artery stenosis. Doppler ultrasonography has unique physical properties. Its 2-dimensional gray scale can be used for measuring the intima-media thickness, which is a very good biomarker for atherosclerosis and can aid in plaque characterization. Plaque morphology is related to the risk of stroke. The ulceration of plaque is also known as one of the strong predictors of future embolic event risk. [12]
A consensus conference of the Society of Radiologists in Ultrasound recommended the following criteria for estimating stenosis: [13]
-
Normal: ICA PSV < 125 cm/s and no plaque or intimal thickening is visible.
-
< 50% stenosis: ICA PSV < 125 cm/s and plaque or intimal thickening is visible.
-
50-69% stenosis: ICA PSV is 125-230 cm/s and plaque is visible.
-
>70% stenosis to near occlusion: ICA PSV >230 cm/s and visible plaque and lumen narrowing are seen.
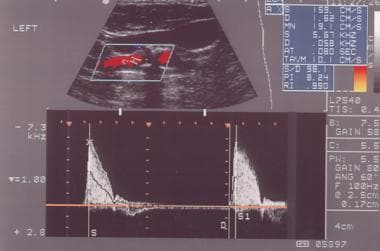
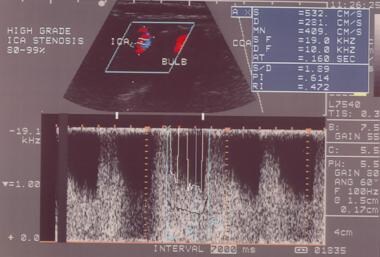 High-grade stenosis as seen on spectral analysis. Note the high frequencies and velocities (532 cm/s systolic and 281 cm/s diastolic).
-
Near occlusion: A markedly narrowed lumen is seen on color Doppler ultrasound.
-
Total occlusion: No detectable patent lumen is seen on grayscale ultrasound, and no flow is seen on spectral, power, and color Doppler ultrasound.

With stenosis over 90% (near occlusion), velocities may actually drop as mechanisms that maintain flow fail. Ratios may be particularly helpful in situations in which cardiovascular factors (eg, poor ejection fraction) limit the increase in velocity. In such cases, ICA/CCA ratios above 3 may signify significant stenosis.
With normal cardiovascular function and normal velocities, changes in ratios should be interpreted with caution.
In patients who have undergone carotid endarterectomy with patch angioplasty, AbuRahma found that ICA PSV of 213 cm/s or more was optimal for detection of 50% or more cases of stenosis, whereas an ICA PSV of 274 cm/s or more was optimal for detection of 80% or more cases of stenosis. [14] End diastolic velocities (EDV) and ICA/CCA PSV ratios were much less reliable.
Carotid duplex ultrasonography may also predict the clinical course of patients with carotid disease. Riles et al found that ICA EDV of 100-124 cm/s was associated with a relatively low rate of stroke (1%) in 97 patients after a mean follow-up of 35 months. [15] Ten patients were initially excluded from analysis because of surgery performed for concomitant symptoms.
Intimal-Medial Thickness
In the Cardiovascular Health Study, increases in the intimal-medial thickness (IMT) of the carotid artery were associated with an increased risk of myocardial infarction and stroke in older adults without a history of cardiovascular disease. [16] CCA IMT greater than 0.87 mm and ICA IMT greater than 0.90 mm were associated with a progressively increased risk of cardiovascular events. For each 0.20 mm increase in CCA IMT, the risk increased by approximately 27%. For each 0.55 mm increase in ICA IMT, the risk increased approximately 30%. IMTs of the CCA and ICA above 1.18 and 1.81, respectively, were associated with more than a 2-fold increase in the risk of a cardiovascular event over 6 years.
The American Society of Echocardiography and the Society for Vascular Medicine and Biology issued a report recommending a standard technique for measuring IMT. [17] The main recommendations were in carotid artery imaging protocol: (1) use end-diastolic (minimum dimension) images for IMT measurements; (2) provide separate categorization of plaque presence and IMT; (3) avoid use of a single upper limit of normal for IMT because the measure varies with age, sex, and race; and (4) incorporate lumen measurement, particularly when serial measurements are performed, to account for changes in distending pressure. The recommendation acknowledges that protocols may vary in the number of segments where the IMT is measured, whether the near wall is measured in addition to the far wall, and whether IMT measurements are derived from B-mode or M-mode images, depending on the application.
Carotid IMT and plaque are recognized markers of increased risk for cerebrovascular events, and accurate visualization of the IMT and plaques depends on image quality. In a study by Shah et al, contrast-enhanced ultrasound (CEUS) improved carotid IMT visualization and plaque detection in an asymptomatic population of 175 individuals, with visualization of the IMT complex and plaque assessments being made during both B-mode and CEUS imaging. Visualization of the IMT was significantly improved during CEUS versus B-mode imaging in both near and far walls of the carotid arteries (% IMT visualization during B-mode vs CEUS imaging: 61% vs 94% and 66% vs 95% for right and left carotid arteries, respectively, P< .001 for both). In addition, more plaques were detected with CEUS imaging than with B-mode imaging (367 plaques vs 350 plaques, P=.02). [18]
Examples of IMT measurements are shown below.
The image below shows normal IMT measurements on B-mode imaging.
The image below shows increased IMT width on B-mode imaging.
-
Continuity rule: Flow in Q1 = Q2 = Q3. Because the area is smaller in Q2, the velocity must increase to maintain flow.
-
Doppler shift: A moving reflector produces a shift in the frequency of the incoming wave.
-
Components of a duplex machine.
-
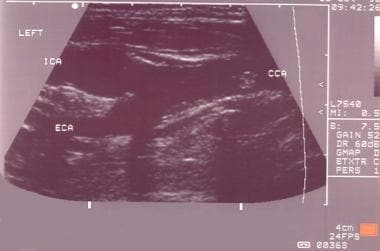
Typical carotid bifurcation seen on grayscale.
-
Internal carotid artery as seen on spectral analysis. Note that flow is continuous through diastole.
-
External carotid artery as seen on spectral analysis. Note the absence of flow in diastole and the sharp upstroke in systole.
-
Power Doppler: Observation of flow is independent of velocity or direction.
-
High-grade stenosis as seen on spectral analysis. Note the high frequencies and velocities (532 cm/s systolic and 281 cm/s diastolic).
-
Normal intimal-medial thickness measurements on B-mode imaging.
-
Abnormal intimal-medial thickness measurements on B-mode imaging.