Overview
Diagnostic tests help physicians revise disease probability for their patients. When ordering a test, the physician should always do so in order to answer a specific question. The 5 main reasons for a diagnostic test are as follows:
-
Screen for disease in asymptomatic patients - For example, prostate-specific antigen (PSA) testing in men older than 50 years
-
Provide prognostic information in patients with established disease - For example, CD4 count measurement in patients with HIV [3]
-
Monitor therapy to ensure appropriate dosing - For example, measuring the international normalized ratio (INR) in patients taking warfarin [4]
-
A test may be performed to confirm that a person is free from a disease - For example, pregnancy testing to exclude the diagnosis of ectopic pregnancy
A criterion (reference) standard test definitively indicates either presence or absence of a disease. Examples of criterion standard tests include pathological specimens for malignancies and pulmonary angiography for pulmonary embolism. However, criterion standard tests routinely have drawbacks: they are usually expensive, less widely available, more invasive, and riskier. These issues usually compel physicians to choose other diagnostic tests as surrogates for the criterion standard test.
For example, venography, the criterion standard for vein thrombosis, is an invasive procedure with significant complications including acute kidney injury, allergic reaction, and clot formation. These risks make venography less desirable than the alternative diagnostic test—venous duplex ultrasonography. The price most diagnostic tests pay for their ease of use compared with their criterion standard is a decrease in accuracy. How to account for this trade-off between diagnostic accuracy and patient acceptability is the subject of this article.
Patient Diagnostic and Screening Decisions
Decision aids such as pamphlets, videos, or Web-based tools may be used to help patients make informed decisions regarding diagnostic and screening options when there is more than one option, when no option has a clear advantage, and when the risk-benefit profile may be valued differently.
A Cochrane review of decision aids for patients facing treatment or screening decisions found that the use of these aids improved knowledge of the options and helped patients have more accurate expectations of possible benefits and harms, reach choices that are more consistent with informed values, and participate in decision making with health practitioners. [5] Smaller improvements were seen with the use of more detailed decision aids compared with simpler decision aids. The use of decision aids had no apparent adverse effects on health outcomes or satisfaction. [6]
Pretest and Posttest Probability
Every clinical encounter begins with an initial clinical impression, which is a subjective pretest probability of disease. The ultimate goal of all diagnostic testing is to refine this pretest probability to the point where the physician can confidently make a treat or no-treat decision. Each diagnostic test whether it is a symptom, sign, laboratory, or radiological examination results in a change in the physician’s probability of disease, the posttest probability. The degree to which a diagnostic test increases or decreases the probability of disease from pretest to posttest represents the clinical utility of the test as measured by its operating characteristics.
A prospective observational multicenter study sought to determine whether the threshold of quantitative D-dimer can be varied according to pretest probability of pulmonary embolism to increase specificity and to maintain a negative predictive value greater than 99%. [7] A diagnostic study was ordered for eligible patients to determine possible pulmonary embolism. Pretest probability was determined by the clinician's unstructured estimate and Wells score. Various threshold measurements were obtained from 5 different D-dimer tests. A quantitative D-dimer test was ordered for 4357 of the 7940 eligible patients who were tested for pulmonary embolism.
Across all pretest probability strata, at standard cutoffs, quantitative D-dimer testing results had a sensitivity of 94% (95% confidence interval [CI], 91-97%), specificity of 58% (95% CI, 56-60%), and negative predictive value of 99.5% (95% CI, 99.1-99.7%). With variable cutoffs, the overall sensitivity would have been 88% (95% CI, 83-92%), specificity 75% (95% CI, 74-76%), and negative predictive value 99.1% (95% CI, 98.7-99.4%). The authors concluded that emergency medicine clinicians currently order a D-dimer in most patients tested for pulmonary embolism, including a large proportion with intermediate pretest probability and high pretest probability. Increasing the specificity with no measurable decrease in negative predictive value can be accomplished by varying the D-dimer's cutoff according to pretest probability. [8, 9]
Definitions and Calculations
Clinical studies of diagnostic tests measure the accuracy of the test against its criterion standard.
Table 1. Criterion Standard (Open Table in a new window)
Criterion Standard Test |
||
|
Disease (+) |
Disease (-) |
Test (+) |
True positive (TP) |
False positive (FP) |
Test (-) |
False negative (FN) |
True negative (TN) |
Table 2. Definition of Terms (Open Table in a new window)
Term |
Calculation |
Plain English |
True positive (TP) |
Counts in 2 × 2 table |
# Patients with the disease who have a positive test result |
True negative (TN) |
Counts in 2 × 2 table |
# Patients without the disease who have a negative test result |
False positive (FP) |
Counts in 2 × 2 table |
# Patients without the disease who have a positive test result |
False negative (FN) |
Counts in 2 × 2 table |
# Patients with the disease who have a negative test result |
Sensitivity = True positive rate (TPR) |
TP / (TP + FN) |
The probability that a patient with the disease will have a positive test result |
1 - Sensitivity = False-negative rate (FPR) |
FN / (TP + FN) |
The probability that a patient with the disease will have a negative test result |
Specificity = True negative rate (TNR) |
TN / (TN + FP) |
The probability that a patient without the disease will have a negative test result |
1 - Specificity = False-positive rate (FPR) |
FP / (TN + FP) |
The probability that a patient without the disease will have a positive test result |
Positive predictive value |
TP / (TP + FP) |
The probability that a patient with a positive test result will have the disease |
Negative predictive value |
TN / (TN + FN) |
The probability that a patient with a negative test result will not have the disease. |
Accuracy |
(TP + TN) / (TP + TN + FP + FN) |
The probability that the results of a test will accurately predict presence or absence of disease |
Bayes’ theorem |
Posttest Odds = Pretest Odds × Likelihood Ratio |
The odds of having or not having the disease after testing |
Likelihood ratio of a positive test result (LR+) |
Sensitivity / (1 - Specificity) |
The increase in the odds of having the disease after a positive test result |
Likelihood ratio of a negative test result (LR-) |
(1 - Sensitivity) / Specificity |
The decrease in the odds of having the disease after a negative test result |
Sensitivity and Specificity
Different diagnostic tests for the same disease often trade sensitivity for specificity or vice versa. In general, the more sensitive a test is for a disease, the higher its false-positive rate, lowering its specificity. A test with a higher specificity will usually sacrifice sensitivity by increasing its false-negative rate. This makes a highly sensitive test ideal for a screening examination, whereas highly specific tests are best in a confirmatory role.
Sensitivity and specificity are calculated vertically in a 2 × 2 table. Sensitivity is measured in patients definitively diagnosed with the disease, whereas specificity is only a function of those free of disease. Sensitivity contains no information about false-positive results, and specificity does not account for false-negative results. This limits the applicability of sensitivity and specificity in predicting disease when the physician is uncertain about the diagnosis. For example, a positive test result with 90% sensitivity does not predict a 90% probability of disease in a patient.
The mnemonics SnOut and SpIn provide some guidelines on how to interpret sensitivity and specificity for an individual patient. SnOut helps physicians to remember that a highly S ensitive test with a n egative result is good at ruling out the disease. SpIn reminds physicians that a highly S pecific test with a p ositive result is good at ruling in the disease.
Predictive Values
To estimate the posttest probability for an individual patient another statistic is needed. Predictive values are horizontally calculated operating characteristics, which incorporate both false-positive and false-negative results into disease probability. The positive predictive value (PPV) is the probability of a patient actually having the disease if the test result is positive. The probability of the patient being free of the disease after a negative test result is given by the negative predictive value (NPV).
Unfortunately, predictive values are not stable characteristics of diagnostic tests. The predictive values are dependent on the prevalence of disease among the population of interest. The same diagnostic test will have varying predictive values in different populations. Without knowing the disease prevalence in the population of interest, predictive values cannot be accurately estimated.
For example, chest CT angiography with venous runoff (CTA VN) has a sensitivity of 90% and specificity of 95%. In a patient with a high probability (78.4%) of a pulmonary embolism according to the Wells’ criteria, the CTA VN would produce a PPV of 99% and NPV of 72%. The same test given to a patient with a much lower pretest probability of pulmonary embolism (3.4%) would result in a PPV of 39% and NPV of 99%.
Bayes' Theorem and Likelihood Ratios
Bayes' Theorem
Adapting a theorem of conditional probability from the 18th century statistician Thomas Bayes solves the problem of calculating posttest disease probability. This theorem allows pretest probability to be separated from likelihood ratio (LR)—a term that describes the strength of the diagnostic test. [10, 11]
Bayes' theorem: Posttest Odds = Pretest Odds × Likelihood Ratio
Likelihood Ratio
Likelihood ratios are proportions of probabilities. [12] A likelihood ratio for a positive test result (LR+) is the ratio of the true positive rate (sensitivity) divided by the false positive rate (1 - specificity). LR+ then can be thought of as how much more likely the patient is to actually have the disease after a positive test result.
Dividing the false-negative rate (1 - sensitivity) by the true negative rate (specificity) gives the likelihood ratio for a negative test result and provides the strength of a negative test result in convincing the physician the patient is free of disease.
Since likelihood ratios are calculated from sensitivity and specificity, they are stable operating test characteristics, unaffected by prevalence of disease.
A test with a likelihood ratio of 1.0 is useless because the result fails to change the opinion of probability of disease from pretest to posttest. The LR+ is always greater than 1.0; the larger the number, the more likely is the patient to have the disease after a positive test result. The LR- is always less than 1.0, with the smaller numbers signifying a lower risk for disease than pretest estimates.
Table 3. Strength of the Test by Likelihood Ratio (Open Table in a new window)
Qualitative Strength |
LR(+) |
LR(-) |
Excellent |
10 |
0.1 |
Very good |
6 |
0.2 |
Fair |
2 |
0.5 |
Useless |
1 |
1 |
Using Bayes' Theorem
Bayes' theorem: Posttest Odds = Pretest Odds X Likelihood Ratio
This form of Bayes’ theorem using likelihood ratios requires the conversion of pretest probability to odds multiplied by the appropriate LR and then reconverted to the posttest odds, back into posttest probability.
Example: What is the probability of a pulmonary embolism in a patient after a positive CTA VN (sensitivity 90%, specificity 95%) if the patient has a pretest probability of 28%?
Table 4. Bayes' theorem: Posttest Odds = Pretest Odds × Likelihood Ratio (Open Table in a new window)
Steps |
Calculations |
1. Convert pretest probability to odds. Odds = Probability / (1 - Probability) |
Pretest odds = 0.28 / (1 - 0.28) = 0.389 |
2. Calculate LR+. LR+ = Sensitivity / (1 - Specificity) |
LR+ = 0.90 / (1 - 0.95) = 18.0 |
3. Calculate Bayes' Theorem. Posttest Odds = Pretest Odds × LR |
Posttest odds = 0.389 X 18 = 7.0 |
4. Convert posttest odds to probability. Probability = Odds / (1 + Odds) |
Posttest probability = 7 / (1 + 7) = 87.5% |
This method requires multiple steps and is inconvenient for bedside use. In 1975, Fagan published a nomogram for the graphical calculation of Bayes' theorem. [13] This nomogram (see image below) only requires drawing a straight line from the patient’s pretest probability through the appropriate LR connecting to the posttest probability.
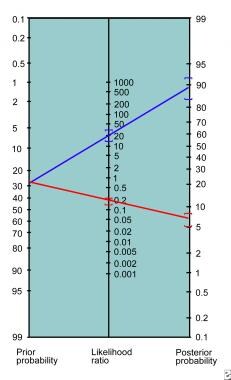 Fagan nomogram.
-
Fagan nomogram.
Tables
Criterion Standard Test |
||
|
Disease (+) |
Disease (-) |
Test (+) |
True positive (TP) |
False positive (FP) |
Test (-) |
False negative (FN) |
True negative (TN) |
Term |
Calculation |
Plain English |
True positive (TP) |
Counts in 2 × 2 table |
# Patients with the disease who have a positive test result |
True negative (TN) |
Counts in 2 × 2 table |
# Patients without the disease who have a negative test result |
False positive (FP) |
Counts in 2 × 2 table |
# Patients without the disease who have a positive test result |
False negative (FN) |
Counts in 2 × 2 table |
# Patients with the disease who have a negative test result |
Sensitivity = True positive rate (TPR) |
TP / (TP + FN) |
The probability that a patient with the disease will have a positive test result |
1 - Sensitivity = False-negative rate (FPR) |
FN / (TP + FN) |
The probability that a patient with the disease will have a negative test result |
Specificity = True negative rate (TNR) |
TN / (TN + FP) |
The probability that a patient without the disease will have a negative test result |
1 - Specificity = False-positive rate (FPR) |
FP / (TN + FP) |
The probability that a patient without the disease will have a positive test result |
Positive predictive value |
TP / (TP + FP) |
The probability that a patient with a positive test result will have the disease |
Negative predictive value |
TN / (TN + FN) |
The probability that a patient with a negative test result will not have the disease. |
Accuracy |
(TP + TN) / (TP + TN + FP + FN) |
The probability that the results of a test will accurately predict presence or absence of disease |
Bayes’ theorem |
Posttest Odds = Pretest Odds × Likelihood Ratio |
The odds of having or not having the disease after testing |
Likelihood ratio of a positive test result (LR+) |
Sensitivity / (1 - Specificity) |
The increase in the odds of having the disease after a positive test result |
Likelihood ratio of a negative test result (LR-) |
(1 - Sensitivity) / Specificity |
The decrease in the odds of having the disease after a negative test result |
Qualitative Strength |
LR(+) |
LR(-) |
Excellent |
10 |
0.1 |
Very good |
6 |
0.2 |
Fair |
2 |
0.5 |
Useless |
1 |
1 |
Steps |
Calculations |
1. Convert pretest probability to odds. Odds = Probability / (1 - Probability) |
Pretest odds = 0.28 / (1 - 0.28) = 0.389 |
2. Calculate LR+. LR+ = Sensitivity / (1 - Specificity) |
LR+ = 0.90 / (1 - 0.95) = 18.0 |
3. Calculate Bayes' Theorem. Posttest Odds = Pretest Odds × LR |
Posttest odds = 0.389 X 18 = 7.0 |
4. Convert posttest odds to probability. Probability = Odds / (1 + Odds) |
Posttest probability = 7 / (1 + 7) = 87.5% |


